

What play types reveal about the second leg of the play-offs
Throughout the course of the EHF Champions League Women and the Machineseeker EHF Champions League, data analyst Julian Rux provides the handball community with deep insights into the numbers behind the game, analysing what the data says about teams’ and players’ performances.

Different play types
For Plock vs Nantes and Aalborg vs GOG the differences are not that clear. The shooting percentages of all four teams were around average with Nantes and Plock (68.1 per cent and 66.7 per cent) slightly higher than Aalborg and GOG (61.2 per cent and 63.6 per cent).
It was similar with the turnovers. All four were around average with Nantes and Plock (7.3 and 9.1 per 50 possessions) being slightly better than Aalborg and GOG (10.0 and 11.6).
Even for second chances the games were similar as one team was clearly better in each game. For Aalborg this was the key to their win with them getting 31.3 per cent of their missed shots back while GOG got no offensive rebounds. In the other game it was Nantes who had an advantage here as 20 per cent of their misses ended up in their hands again while it was just 6.3 per cent for Plock.
So, to really find differences between these games an even deeper dive into the advanced statistics is needed. One insightful possibility is so-called play type statistics. This data categorises every offensive possession by the type of play the possession ended with, such as isolation, transition or spot-up. Defensive and offensive formations and superiority or inferiority can be included in the analysis as well. A detailed explanation of the 13 different play types can be found here.
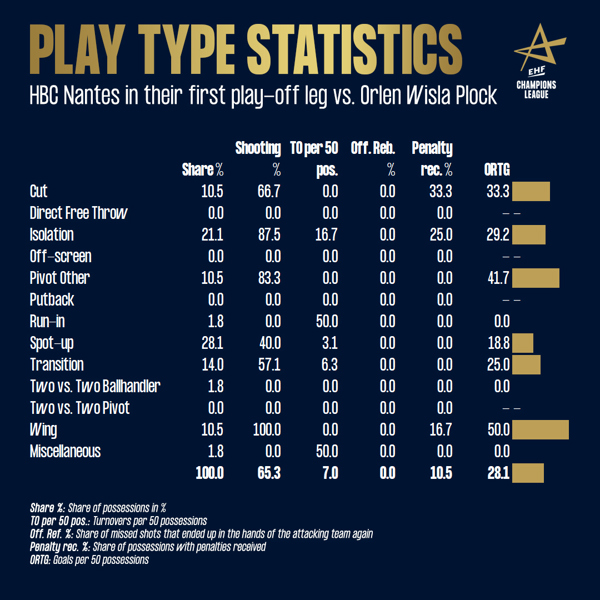
Comparing the games of Plock against Nantes and Aalborg against GOG based on these play type statistics, various differences can be seen. For all four of them, spot-ups – the more or less direct shot after a pass, mostly from back court – were the most used play type with a share between 26.8 (GOG) and 34.5 (Aalborg). The overall efficiency varied from 18.8 goals per 50 possessions (Nantes) to 26.3 (Aalborg).
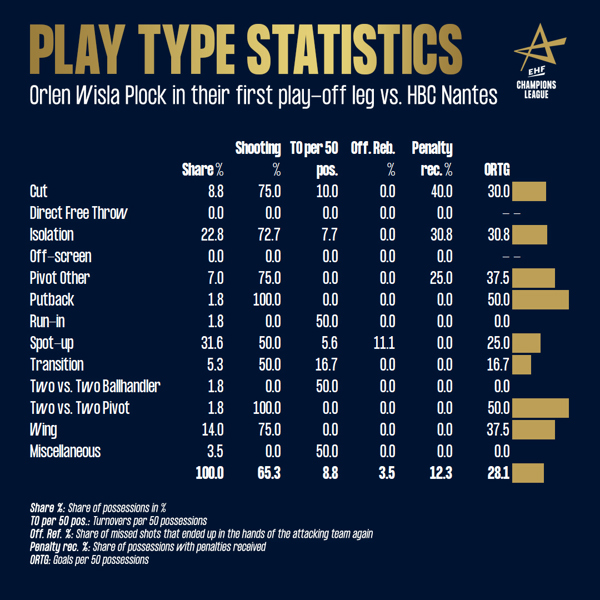
After that it gets interesting. For Plock and Nantes, the second most used play types were isolations (22.8 per cent and 21.1 per cent of their possessions). From one-on-one situations both were clearly more efficient than from spot-ups with Plock scoring 30.8 goals per 50 possessions and Nantes 29.2 and (almost) all their other statistics improved as well.
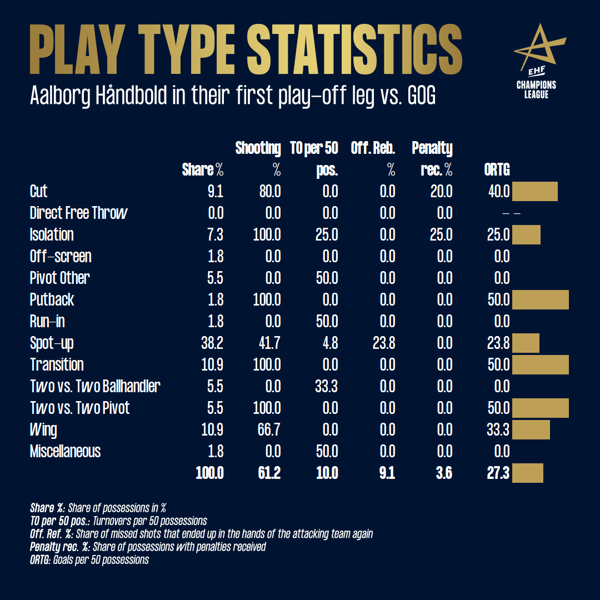
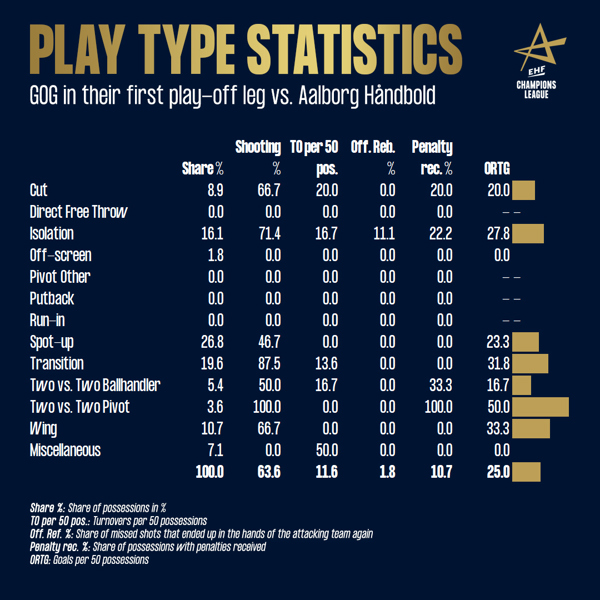
For GOG, isolations were the third most used play type (16.1 per cent and 27.7 goals per 50 possessions) after spot-ups and transitions (19.6 per cent and 31.8 goals per 50 possessions). For Aalborg the (extended) fast break was second as well with transition making 10.9 per cent of their possessions where they scored on each. Wing shots made up the same amount where they scored a very good 33.3 goals per 50 possessions.
Isolations, however, are not a strength of Stefan Madsen’s team. Just 7.3 per cent of their possessions were one-on-one situations where they only scored 25.0 goals per 50 possessions.
The key players in MOTW
The numbers also show that while the teams have similar or different approaches on how to score in the end, overall, they were just very close. This promises two exciting second legs in the Denmark duel and the MOTW between Nantes and Plock.
In latter game the decisive offensive battle could once again be Thibaud Briet vs Dmitry Zhitnikov. In the first leg, the two took the reins for their teams. A total of 24.6 per cent of Nantes’ possessions ended in the hands of Briet, while Zhitnikov had 19.3 per cent of Plock’s possessions.
The efficiency duel clearly went to Zhitnikov who created 30.7 goals per 50 possessions used, while Briet created only 22.3 goals per 50 posssessions.
In every almost aspect the numbers of Plock’s centre back were better than the French national player’s. His shooting percentage was higher (60.0 per cent vs 44.4 per cent), he caused fewer turnovers (4.5 per 50 possessions vs 7.2) and more of his missed shots ended in a second chance (9.1 per cent vs 0 per cent). Briet was only more successful at seven-metre penalties drawn (21.4 per cent of his used possessions vs 9.1 per cent).
Some 64.3 of Briet’s used possessions were spot-ups and he had big efficiency problems there, creating only 16.7 goals per 50 possessions. His second most used play type, isolations (28.6 per cent), were very efficient with 31.2 goals created. So, one key for Nantes to be successful in the second leg would be to either get Briet into better spot-up situations or rather more isolation possessions.
Zhitnikov played very similar. The majority of his possessions were spot-up situations as well (72.7 per cent), while isolations were second (18.2 per cent). However, the efficiency is the other way round. Out of spot-ups he created 37.5 goals per 50 possessions, while in isolations it was only 18.8. So, as far as that is concerned, no change is necessary for Plock to have a successful second leg.
More from data analyst Julian Rux can be found at Handballytics.de. There you can read his latest articles, in which he analyses all kinds of handball topics from new, data-based perspectives. You can also find him on Instagram, Facebook and Twitter.
Photos © Henrik Hansen, Mihai Neacsu, Jerzy Stankowski Spojrzenia


