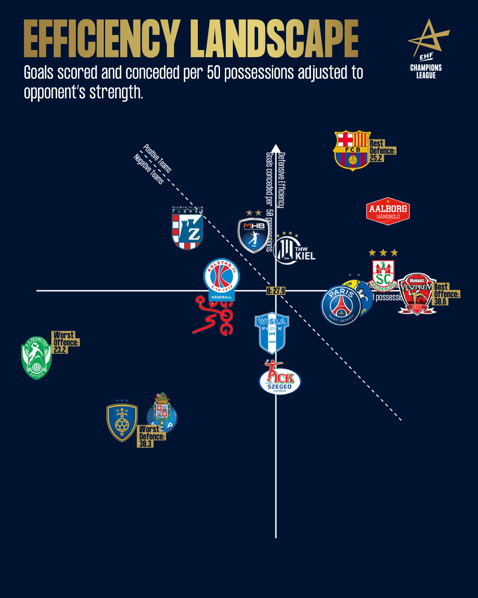
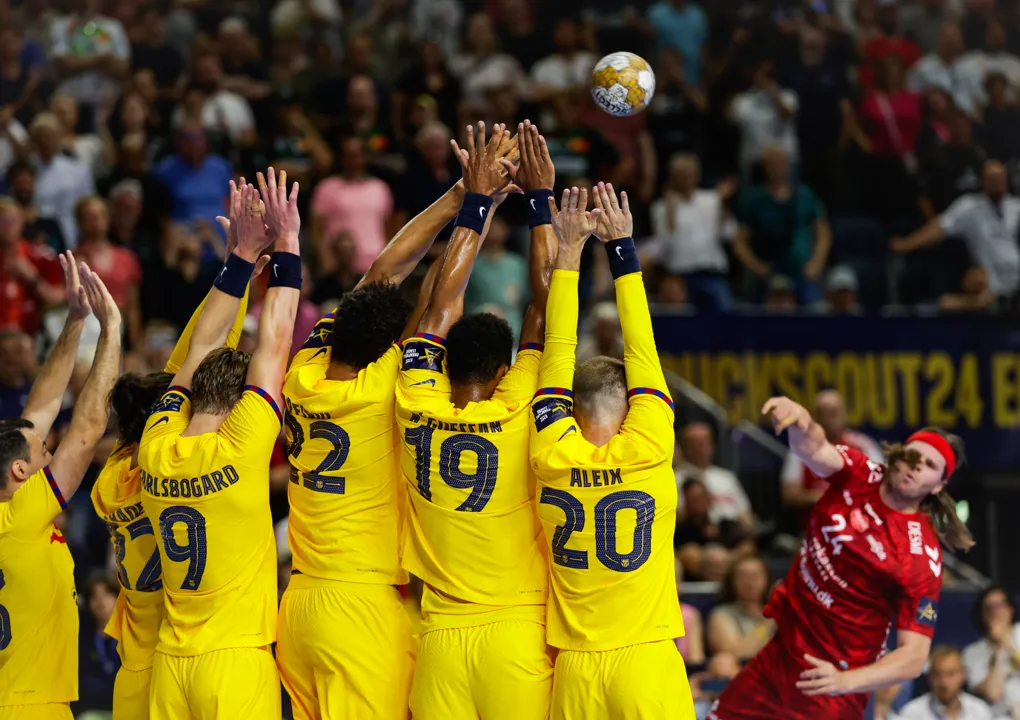
In a nail-biter that was decided with the last shot, Barça won the Machineseeker EHF Champions League for the 11th time with a 31:30 win over Aalborg Håndbold. It was of course hardly surprising that the match was so close, since fittingly the two were the best teams of the season according to the numbers as well.
To find out who the best teams of the season were, the team statistics have to be adjusted for possessions played to have a fair comparison. This way the numbers are significantly more meaningful than just the raw number of goals scored or conceded. It makes the teams actually comparable since the raw number of goals is not only influenced by efficiency, but also by the number of possessions (whether a team and their opponents play rather fast or slow).
Since a game has roughly 50 possessions on average (52.9 this season), the values here are calculated on 50 possessions so that they roughly reflect those of a game.
However, in competitions such as the EHF Champions League where not every team plays the same number of matches against equally strong opponents, as teams such as Barça or Aalborg that made it far in the competition had face remarkably harder opponents than teams that were eliminated early. To take this into account, these aforementioned metrics can be adjusted for opponent strength as well.
The adjustment is done by calculating how many goals (conceded) per 50 possessions would be expected for each game and team, by the number of goals the opponents scored and conceded per 50 possessions in their other games. So-called “dead time” where games are already decided before the final few minutes is also filtered out. The differences between the actual goals scored and conceded can then be added to the goals scored or conceded per 50 possessions to have an adjusted rating.
The results of this method show that Barça had a good attack, but there is still room for improvement. 29.4 goals per 50 possessions adjusted to opponent’s strength was the fifth best attack this season. Aalborg finished the season as second best attack with 30.1. Only Telekom Veszprém HC was more efficient when scoring is adjusted to their opponents’ strength, 30.6 goals per 50 possessions.

But similarly to last weekend’s winner of the women’s EHF Champions League, Györi Audi ETO KC, the best defence of the competition won the title. Adjusted to their opponents’ strength Barça conceded just 25.2 goals per 50 possessions, by far the best in the competition. Second-ranked is the silver medal winner Aalborg Håndbold with 26.4.
The difference between the opponent adjusted rating for offence and defence gives a very good indicator of the actual strength of the teams over the whole season. Fittingly, Carlos Ortega’s team finished first here as well with +4.2, while Aalborg ended up in second place with +3.7.
To third-best Telekom Veszprém HC there is a clear gap as they have exactly one point fewer with +2.7. SC Magdeburg dropped below the Hungarian side with their disappointing performances in the TruckScout24 EHF FINAL4 2024 and finished this ranking fourth with +2.5.
Details made the difference
Even though Barça had such a great defence over the whole season, Aalborg’s strong attack demanded everything from them in the final. Lead by their star Mikkel Hansen, who scored eight goals from 12 attempts (5/5 7m, 3/5 from the field, 0/2 direct free throws) in his last club game, Stefan Madsen’s team scored 28.8 goals per 50 possessions. Even though it is slightly below Aalborg’s average, that is the fourth-most Barça’s strong defence allowed this season.
Especially interesting were the turnover numbers, as both teams had fewer than on average this season but forced fewer as well. Over the season neither Barça nor Aalborg were especially strong in either forcing or preventing turnovers. Per 50 possessions, Aalborg lost the ball just 6.7 times, which is 1.5 less than their average this season and 2.6 less than Barça’s opponents usually had.
But it didn’t make much of a difference since the Catalans also lost the ball just 6.9 times per 50 possessions in the final. (Unadjusted both teams had seven turnovers, but Aalborg had one possession more). Over the whole season they had 7.9 turnovers per 50 possessions, while Aalborg forced 8.6.
In the end, small details made the difference on Sunday. The new champions simply were slightly better in shooting percentage (63.2 per cent vs. 61.2 per cent) and had more second chances (after 27.8 per cent of their misses vs. 21.1 per cent).


